You’ve got a brilliant idea, and you want to bring it to life with visuals. But here’s the catch: you’re not looking to spend hours dragging your mouse across Photoshop, Visio, or some other heavyweight design tool. You’re not chasing aesthetics worthy of a glossy presentation—just a clean, effective visual to express your thoughts. And let’s be real: you’re not eager to shell out money for fancy software either.
Whether it’s a dependency graph or a timeline-driven Gantt chart, you simply need a way to communicate structure and flow—quickly, clearly, and for free.
That’s where Mermaid steps in.
Mermaid lets you generate diagrams and flowcharts using plain-text syntax. Want to sketch out project timelines with task dependencies? Use Mermaid’s Gantt chart feature. No clicking, dragging, or design expertise needed—just code, render, done. It’s perfect for tech-savvy minds who value speed and simplicity.
This is an open source application with lots of ports and comes with implementations that can be plugged into other applications. You just need to learn simple syntaxes which does not need more than 30 mins. But once you go through that you can recreate different complex graphs in no time. Those are good looking too. In fact many of them can be used on business presentations as well. Mermaid also gives you option to get all these things done without downloading a thing. Yes, you got it right, they have a web application as well. The over options you have is to install the application and use any text editor
GraphViz (short for Graph Visualization is another set of applications, first published way back in 1991 by AT&T Labs Research and is open source. This is still very relevant and can visualize very complex graph. It uses DOT language. DOT is a graph description language. DOT graphs are typically file with extension gv or dot . dot, neato, twopi, circo, fdp, and sfdp etc are part of the GraphViz program and can process dot files.
GVedit tool combines a text editor with noninteractive image viewer and can be used out of the box
Mermaid input syntax
Common use of mermaid graph is flow. Here is sample syntax of a top to down flow graph. It starts with a graph definition which is Graph follower by direction of flows.
Direction may be
- Top to bottom or down, represented by TD or TB.
- Bottom to top represented by BT
- Right to left represented by RL
- Left to right represented by LR
Example start line is Graph TD
Node
Next is node. Node is represented by a character or word. Multiple words can be added in a node. Node shapes are rectangle [ ] , rounded rectangle ( ) , diamond { } , circle (( )), asymmetric > ]
Link between Nodes
an arrow head is represented by –> between nodes. — represents link with out head. -.-> represents dotted link texts on the link are done puting the text between | | .
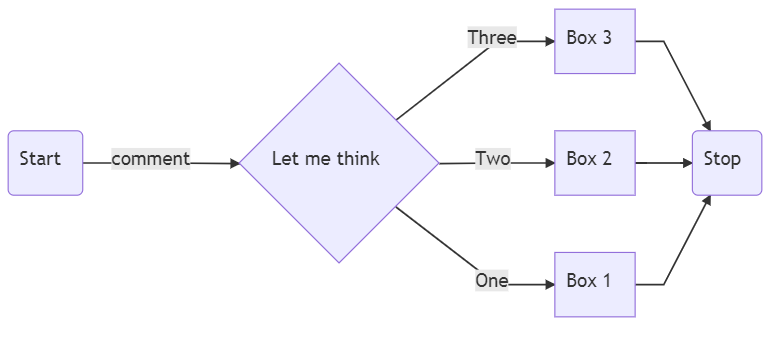
Following is the entire code used to create the Picture here
Graph TD
A(Start) -->|comment| C{Let me think}
C -->|One| D[Box 1]
C -->|Two| E[Box 2]
C -->|Three| F[Box 3]
F -->G(Stop)
E -->G
D -->G
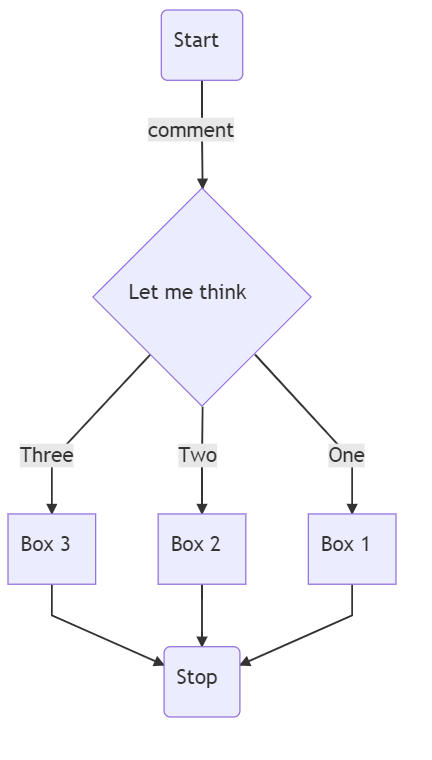
The same code but direction is changed by changing the direction on on the first line ( Simply changing TD to LR ). Following is the code and and graphs
Graph LR
A(Start) -->|comment| C{Let me think}
C -->|One| D[Box 1]
C -->|Two| E[Box 2]
C -->|Three| F[Box 3]
F -->G(Stop)
E -->G
D -->G

So thats fun and it is super easy to create graph simply by writing.
I would like to cover Mermaid in greater details with other supported graph format in future articles. GraphViz syntaxes are very close to Mermaid texts. If you want to explore GraphViz and get started, please feel free to check my article Writing graph with GraphViz