Business Process Model Notation (BPMN) is a graphical notation that can be used to depict internal Business processes in a standard way and shared or collaborated. There are number of commercial tools that can do this. Today our focus is one of the excellent tool yED to get this Job done with ease. yED Graph Editor is a powerful Graph Editor from yWorks. It can be used to create graph manually with ease or data can be imported to create a graph out of it in different layouts. Desktop version runs on all major platforms: Windows, Unix/Linux, and macOS. They also have an online version yED Live, which runs on all major browsers. Interface or Looks in Online and Desktop versions are very close to each other. So, we will go through the online version in this article
Learning curve for the application is also very stiff. You would be able to get going within few mins.
yED Live
Though, interfaces looks almost similar, I personally prefer the online version. This gives more options for icons. There are several addition of AWS, Cisco or Font Awesome icon available on the online version and not available on the desktop version at the time of writing. You may launch the app from yED Live link.
Placing Nodes or Icons
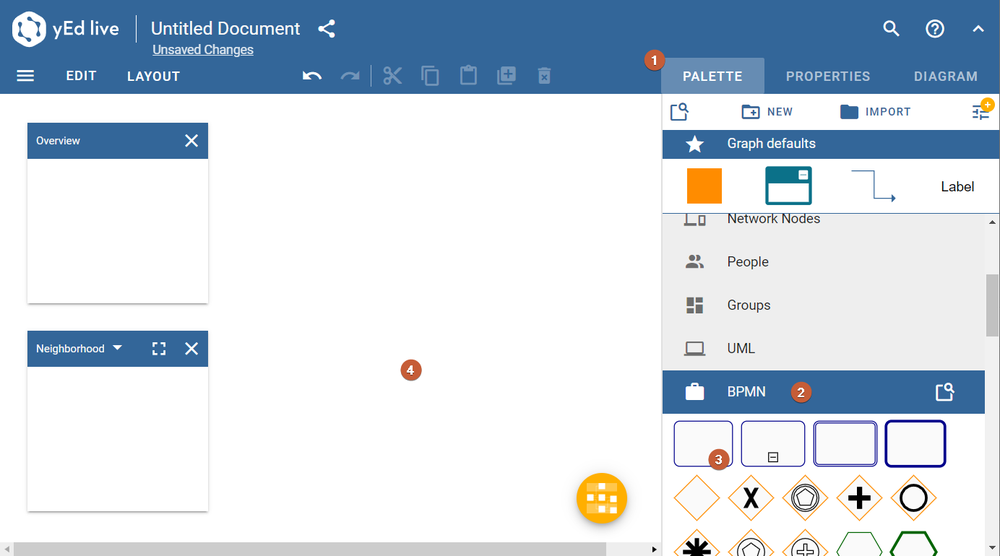
After launching you can see different sections. the sub-window on the right called pallet 1️⃣ . You will find all necessary icons / elements / nodes in the subsection of the pallet for supported diagram types. Let us expand BPMN 2️⃣ section. Now, you are able to click on any of the element or node 3️⃣ and drag it to the drawing board 4️⃣ and release your mouse. For that matter, you may expand any section and drag any node to the drawing section.
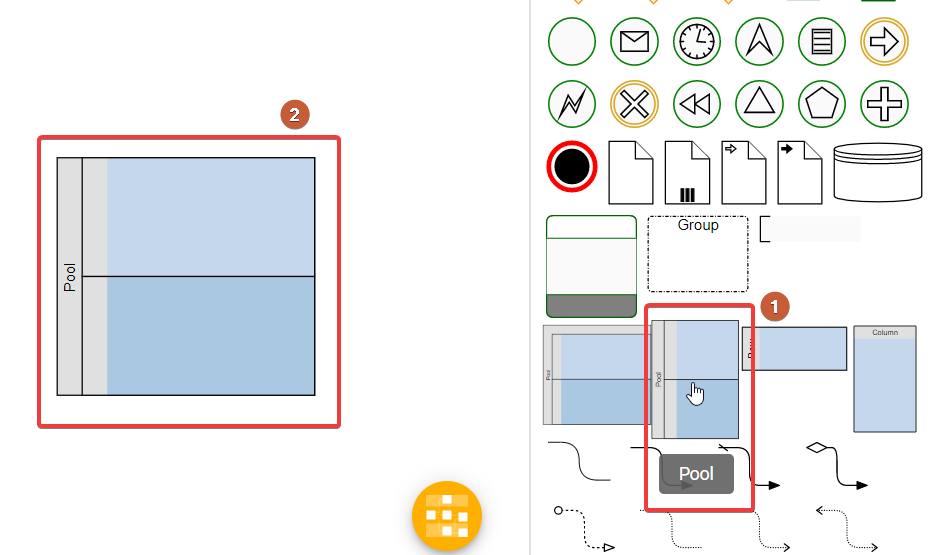
For BPMN diagram, we normally, look for swim lanes. If you scroll down in the BPMN subsection, you will find all BPMN related nodes including different options for swim lanes. But options does not stop at the ones that you can see in the section. once you drag a pool including swim lane templates, you can expand a lane or add new lanes. You can obviously name a Lane or the the Pool in the following picture, a pool 1️⃣ can be seen placed into the drawing area 2️⃣. The lanes were dragged at the edges to make room for Nodes into it
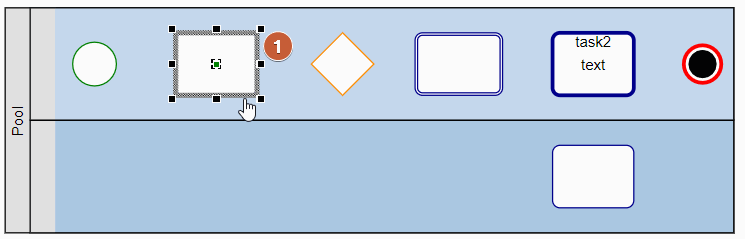
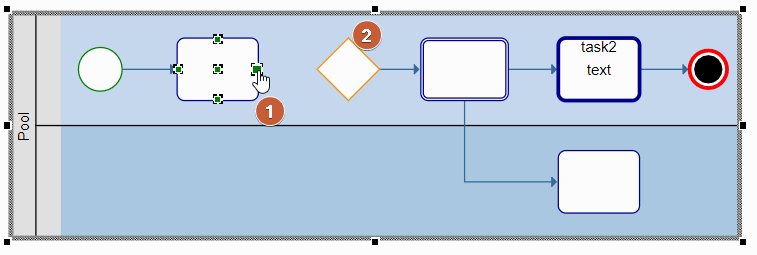
Next step is dropping more BPMN nodes `on top of lanes of the pool. If you want to move a node in and around, you need to first select it 1️⃣ and then drag and drop where you want to move as picture below
Connecting Nodes
Now lets connect the Nodes. This part is tricky. the source node that you want the arrow generates from should not be already selected. You may select a different element or can click outside the pool in the Drawing area.
After ensuring that the source node is not selected, hover over the node and you will see possible source points on like in the picture below in point 1️⃣ marker. Click on any of the markers and then drag your mouse and drop it over the destination node. When mouse is over the destination node, it will show possible join points on the target as well. release the mouse on the desired destination connection point.
Default connection type is arrow to the target. You can change this and is covered in next section
Working with Labels
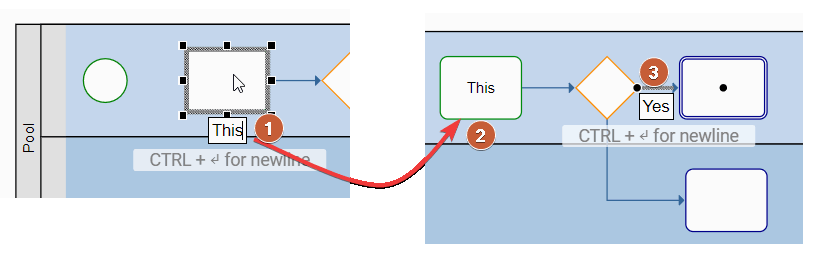
Now, we have Nodes that are connected. But the Nodes needs to some texts in it or around to make the diagram more meaningful. Sometimes also the connectors or edge also need some text e.g. "yes", "No" etc. Double click on any element including the connecting line (edge) will give you an option to enter text. Highlighted step 1️⃣ and 3️⃣ in the below picture
Formatting elements
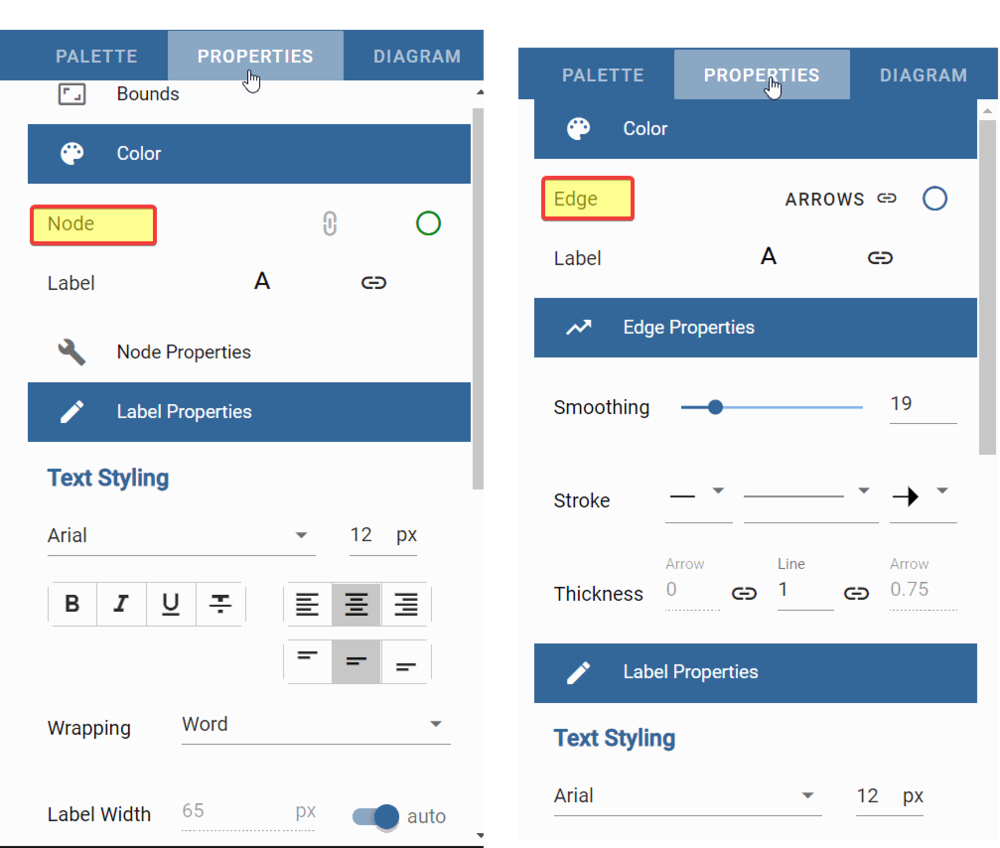
It is now time to go one step further to make visual enhancements to the drawing we have made. It is now time to go one step further to make visual enhancements to the drawing we have made. To do that you have to select the element that you want further formatted and click on the Properties on the right side of Palate. You can change background color, edge color, change font type and color, change connection line type or arrow type etc. There are several subsection in each sub properties.
Depending on what you have selected, the properties windows content will change and you you will get relevant options for the Edge or Node type. There are lots of options to play around to make it more customized to your needs
Saving BPMN
Finally, it is time to save it and share it with others. the menu activated when you click on the three horizontal line on the left top. Among other options, you can save it to cloud on Google Drive, OneDrive or DropBox or save it to your local drive as native graphML format. You can Export it as pdf, SVG or PNG graphic files to share with others
Other resources
If you are interested more on BPMN then this might help you furtherVisualizing Business Process Diagrams with yFiles - BPMN